Webexpenses’ new dashboard offers Accounts and Admin users an interactive way of analysing a high-level overview of company spend in a visual format. Once logging in to your Webexpenses desktop account, accounts and admin users will see the new dashboard. The other platform features will still be visible.
A drag and drop feature is included which allows users to move widgets to match their desired layout. There’s also an option of resetting the layout by simply clicking the restore button on the top right.
If you use Webexpenses in the same browser, your board will remain personalised depending on how you relocate and customise widgets (e.g. tracking Top 10 Categories over a 6 month period). Your browser will cache your dashboard layout and it will be retained for when you next sign in.
So, which features are included in the new dashboard?
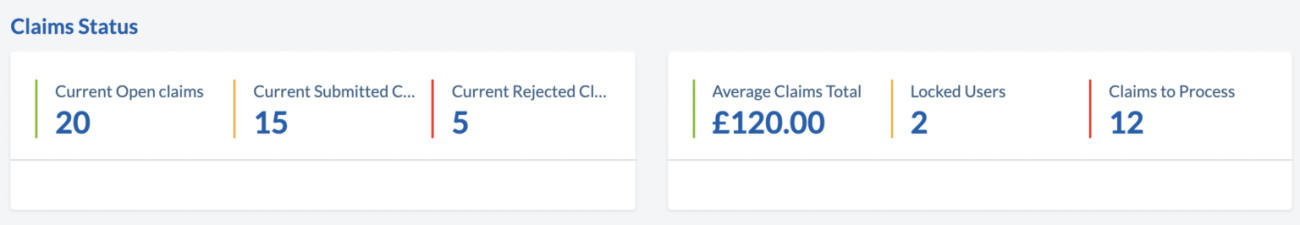
Claims Status
The first widget on the list is Claims Status. Located at the top, on the left-hand side, Claims Status keeps track of your open claims, submitted claims and rejected claims to date. On the right, it also gives an overview of the average claims made over a 12 month period including locked users and claims to process. This includes your businesses’ entire division.
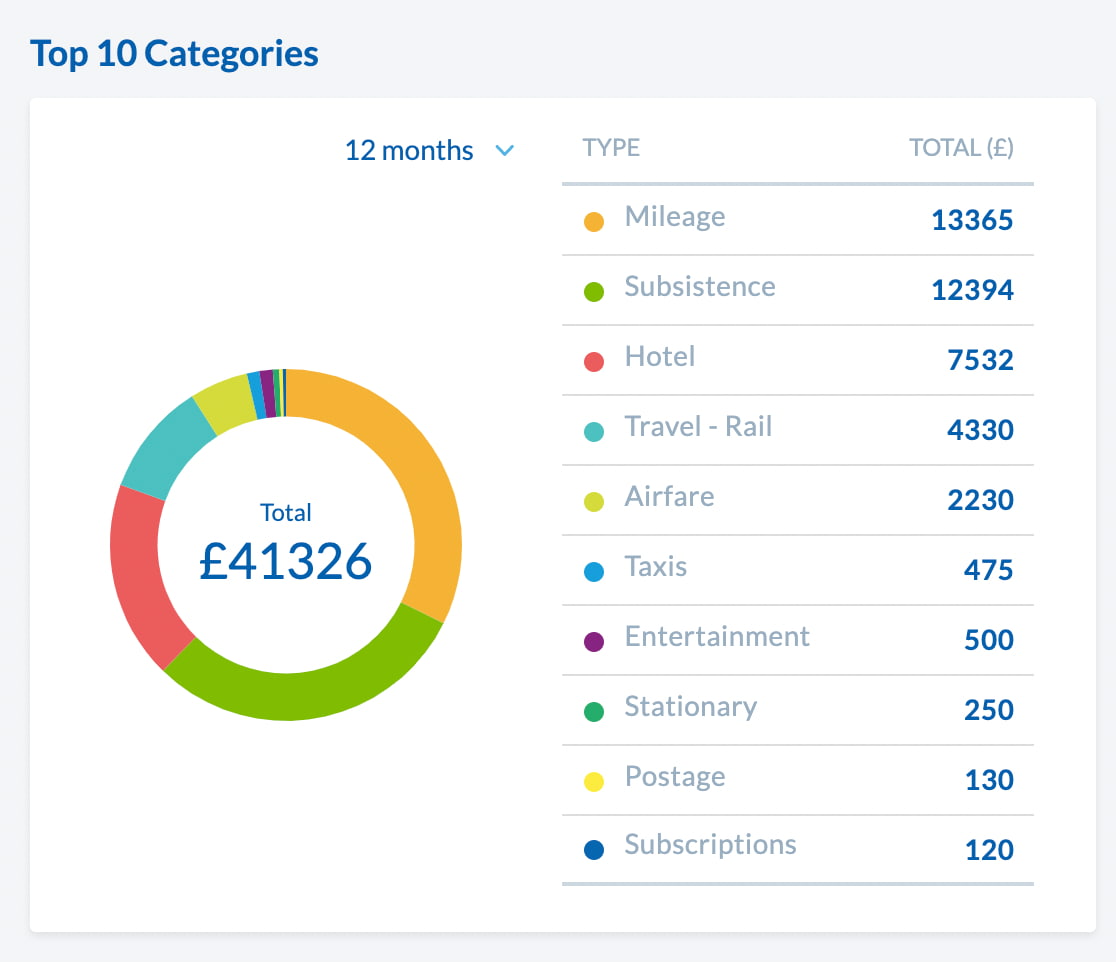
Top 10 Categories
Next, is The Top 10 Categories widget. Presented in a doughnut chart, this highlights the most popular claims made including total costs. This can provide a great way of analysing how expenses are being managed across the business.
Tip: If you want to keep track of a specific period of time, your browser will cache the drop-down selection; meaning you’ll be able to follow the changes every time you log into Webexpenses.
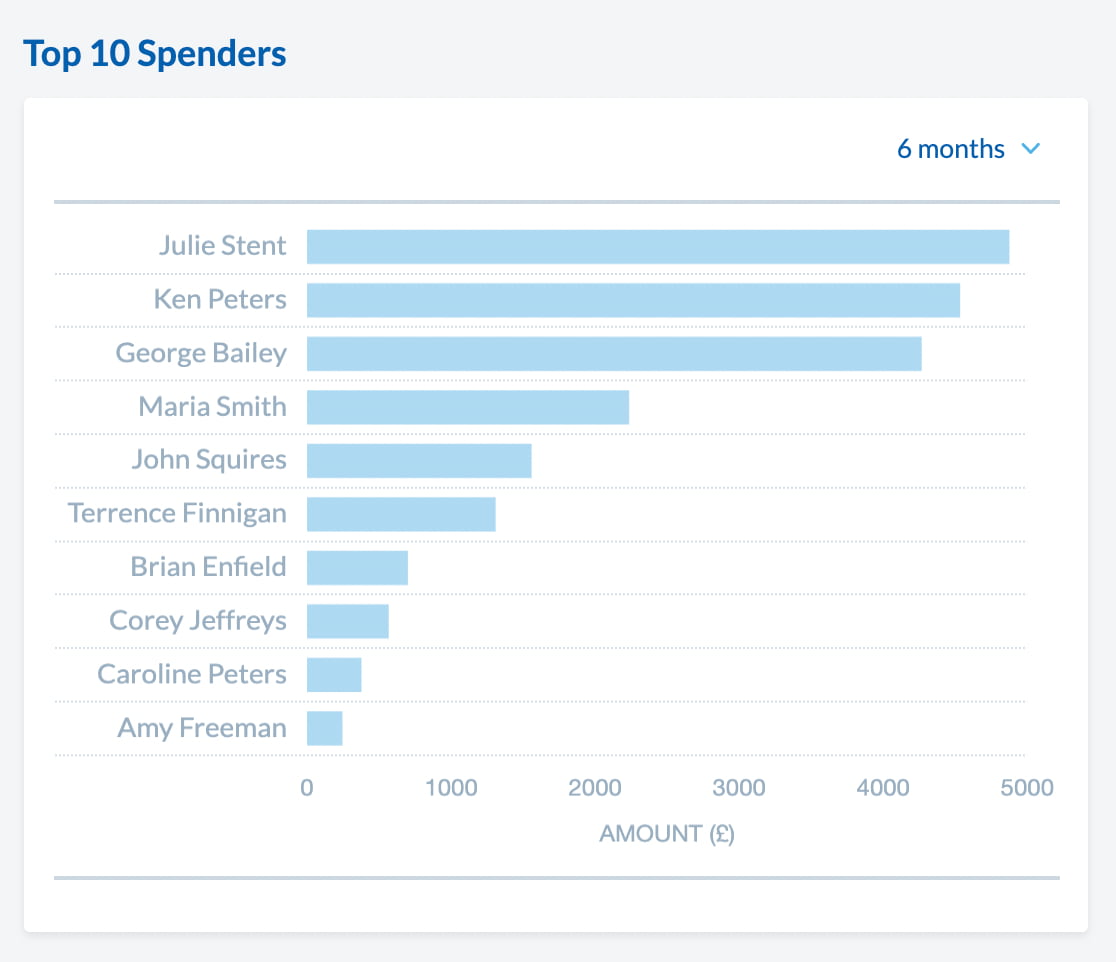
Top 10 Spenders
How about your Top 10 Spenders? This widget can be set up depending on which division you’re in and similarly to Top 10 Categories, can be filtered across 3, 6 and 12 months. The best part? It works when claimants are on business travel. If a claimant is working in a different country, Webexpenses’ exchange rate feature will ensure money is exchanged correctly.
Spend Forecast
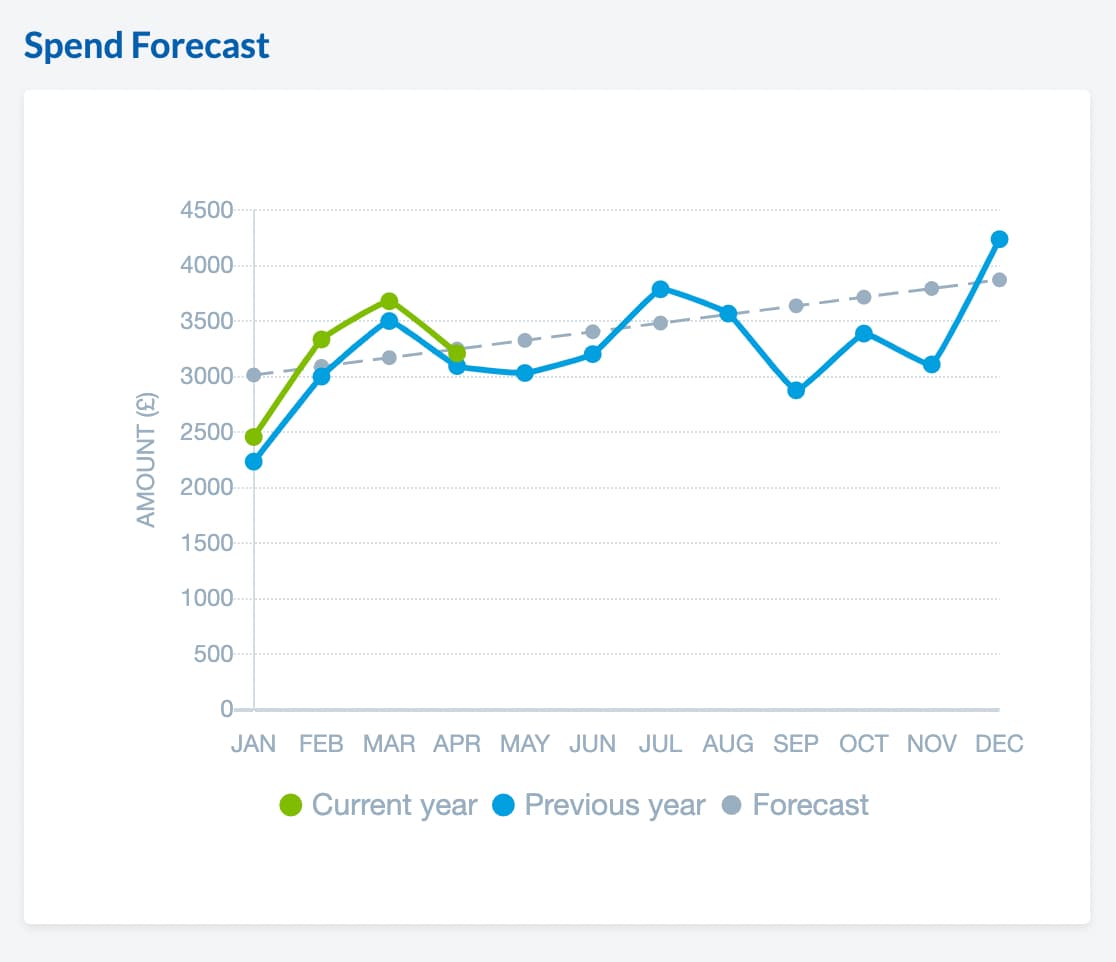
Estimations are made easier with Webexpenses’ Spend Forecast widget. The widget displays two different axes: the left shows the total spend over the period of time (bottom). The blue line highlights last year’s spend whilst the green line displays this year’s predicted spend.
The grey dotted line projected spend based on your company data. And the forecast will take into consideration data up to seven years and average the total amount.
You may hide any of these by simply clicking the corresponding legend.
Tip: To utilise this widget, you must have at least 12 months of data to have a comparative difference.
Time to Review
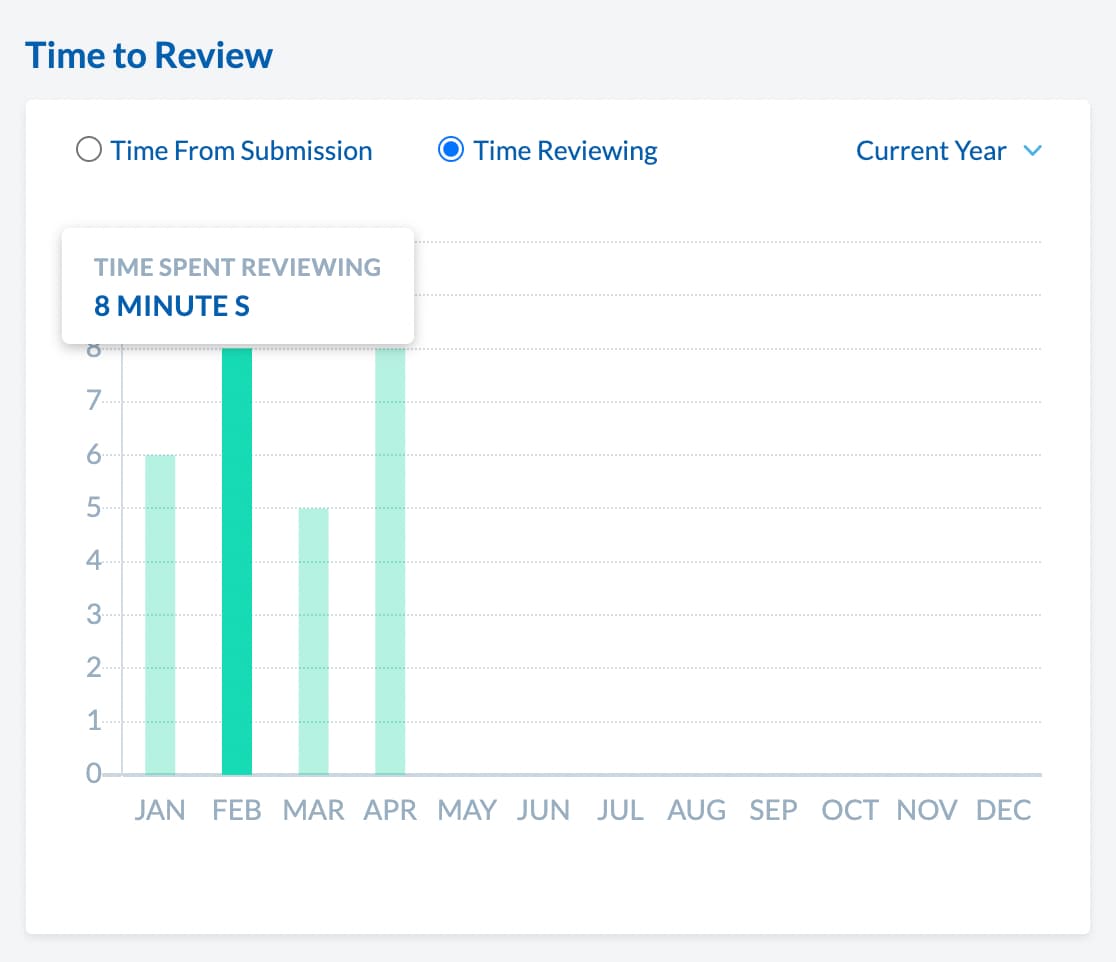
With Time to Review, you can track the average time spent approving a claim and the average time spent on submission to approval. This will share insight into how long it takes for an Admin to review a claim all the way through to the time taken to submit. Using this feature can help spot errors and dictate whether users are using the software efficiently.
Travel Claims
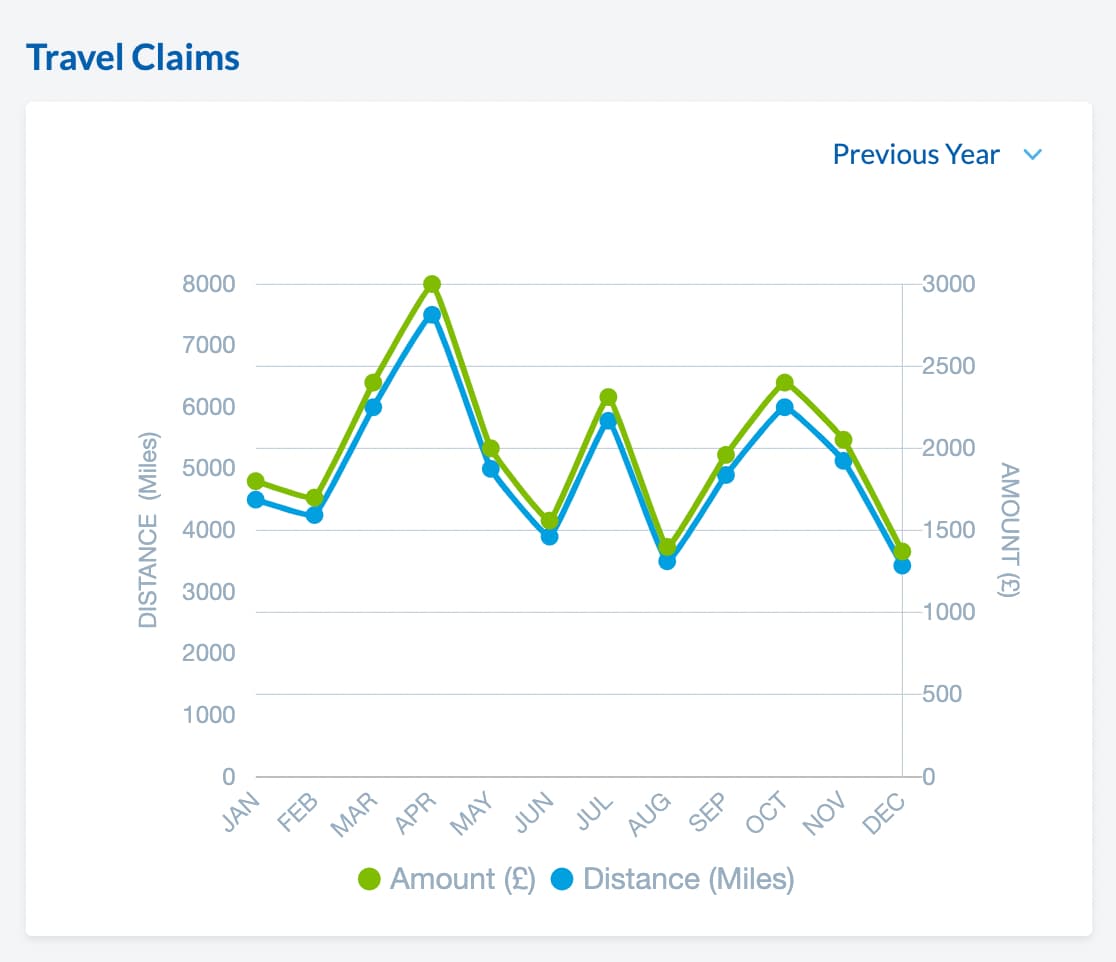
Keep track of accumulated mileage with Travel Claims. This widget shares an overview of the previous year’s mileage in comparison to the current year. The graph gives you a visual representation of where peaks in mileage may have occurred throughout the year.
Top 5 Out of Policy Approvers
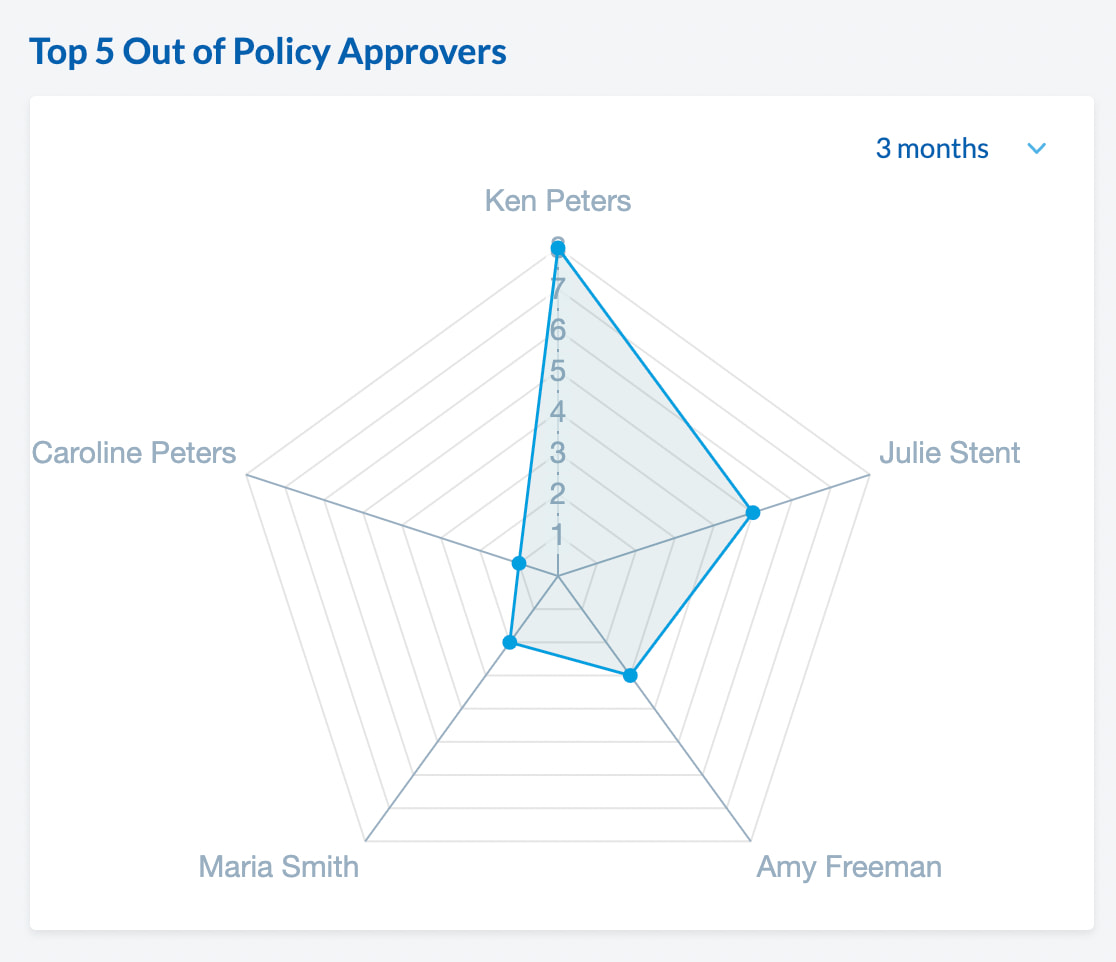
With Webexpenses, your expense management system can be altered to include your businesses policy data. However, policy errors may still occur. With this new feature, Webexpenses can help to spot inaccuracies across the business. This allows you to spot and fix errors efficiently and see how well approvers are doing.
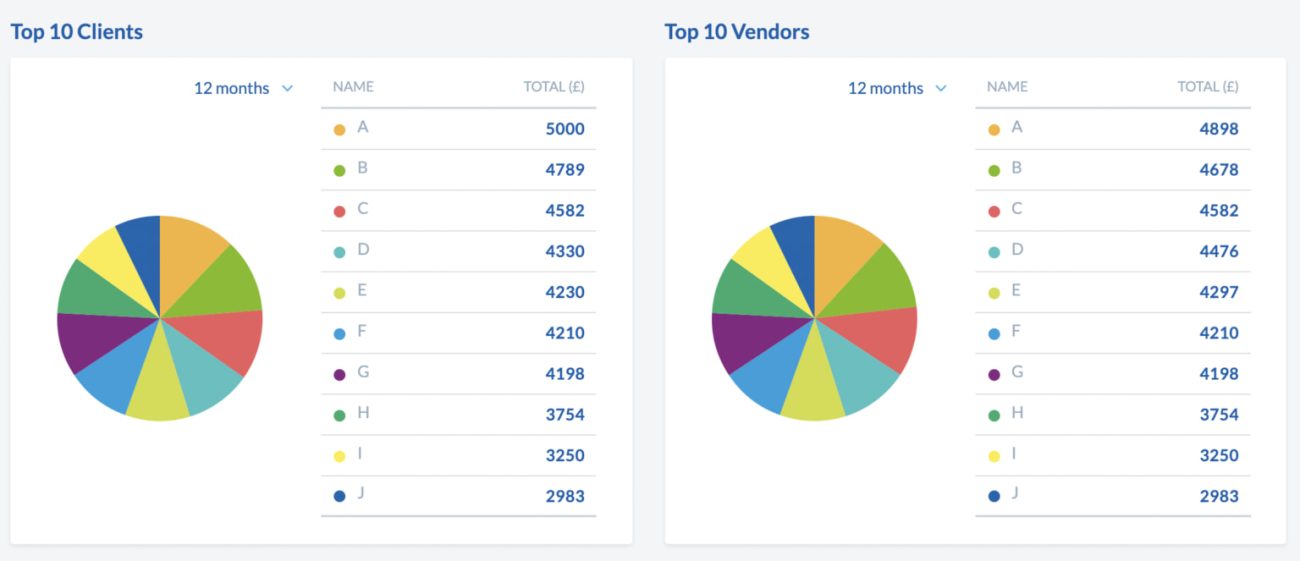
Top 10 Clients and Vendors
Similarly to Top 10 Spenders and Categories, here you can track which clients have attained the highest spend across the month. When you hover over the doughnut, you can see the total amount for each category. The drop-down bar allows you to alternate between 3, 6 and 12 months.
Tip: If you’d rather track different metrics, these widgets can be personalised to fit your businesses requirements.
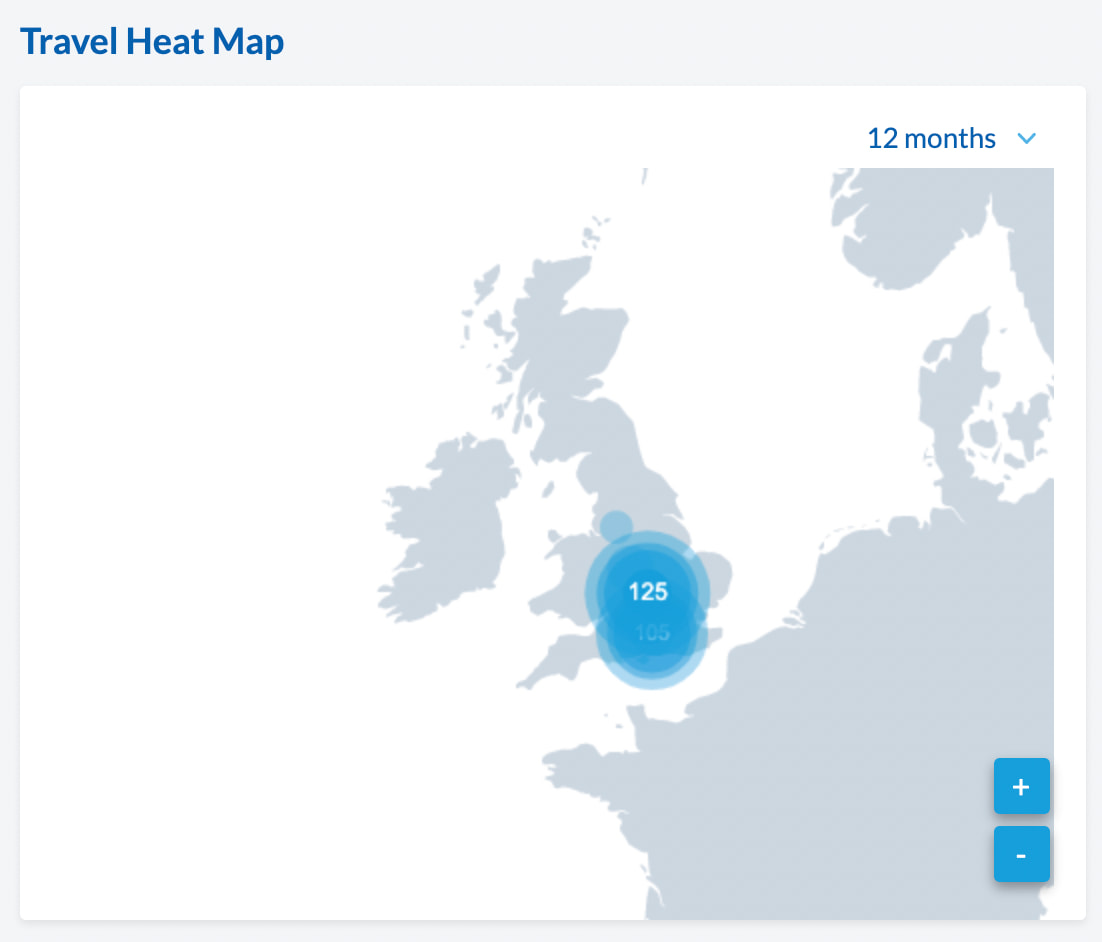
Travel Heat Map
The Travel Heat Map is a great way of tracking where claimants are when claiming for an expense. Depending on its frequency, a blue dot will appear in the location where claimants are most actively submitting a claim. There is an option to zoom in and out of the map, however, it will auto-zoom on the region with higher claims.
Note: Under GDPR regulations, to use this feature you will need to give consent for Webexpenses to store locational data within the database. The data will be held for a year and will not be passed on to third parties.
Do you have any suggestions?
To make your user experience with Webexpenses as seamless as possible, we welcome any feedback. Reach out to your Account Manager if you have any questions or suggestions regarding the dashboard feature.