
At a glance
Contents
| Figure | What it means |
|---|---|
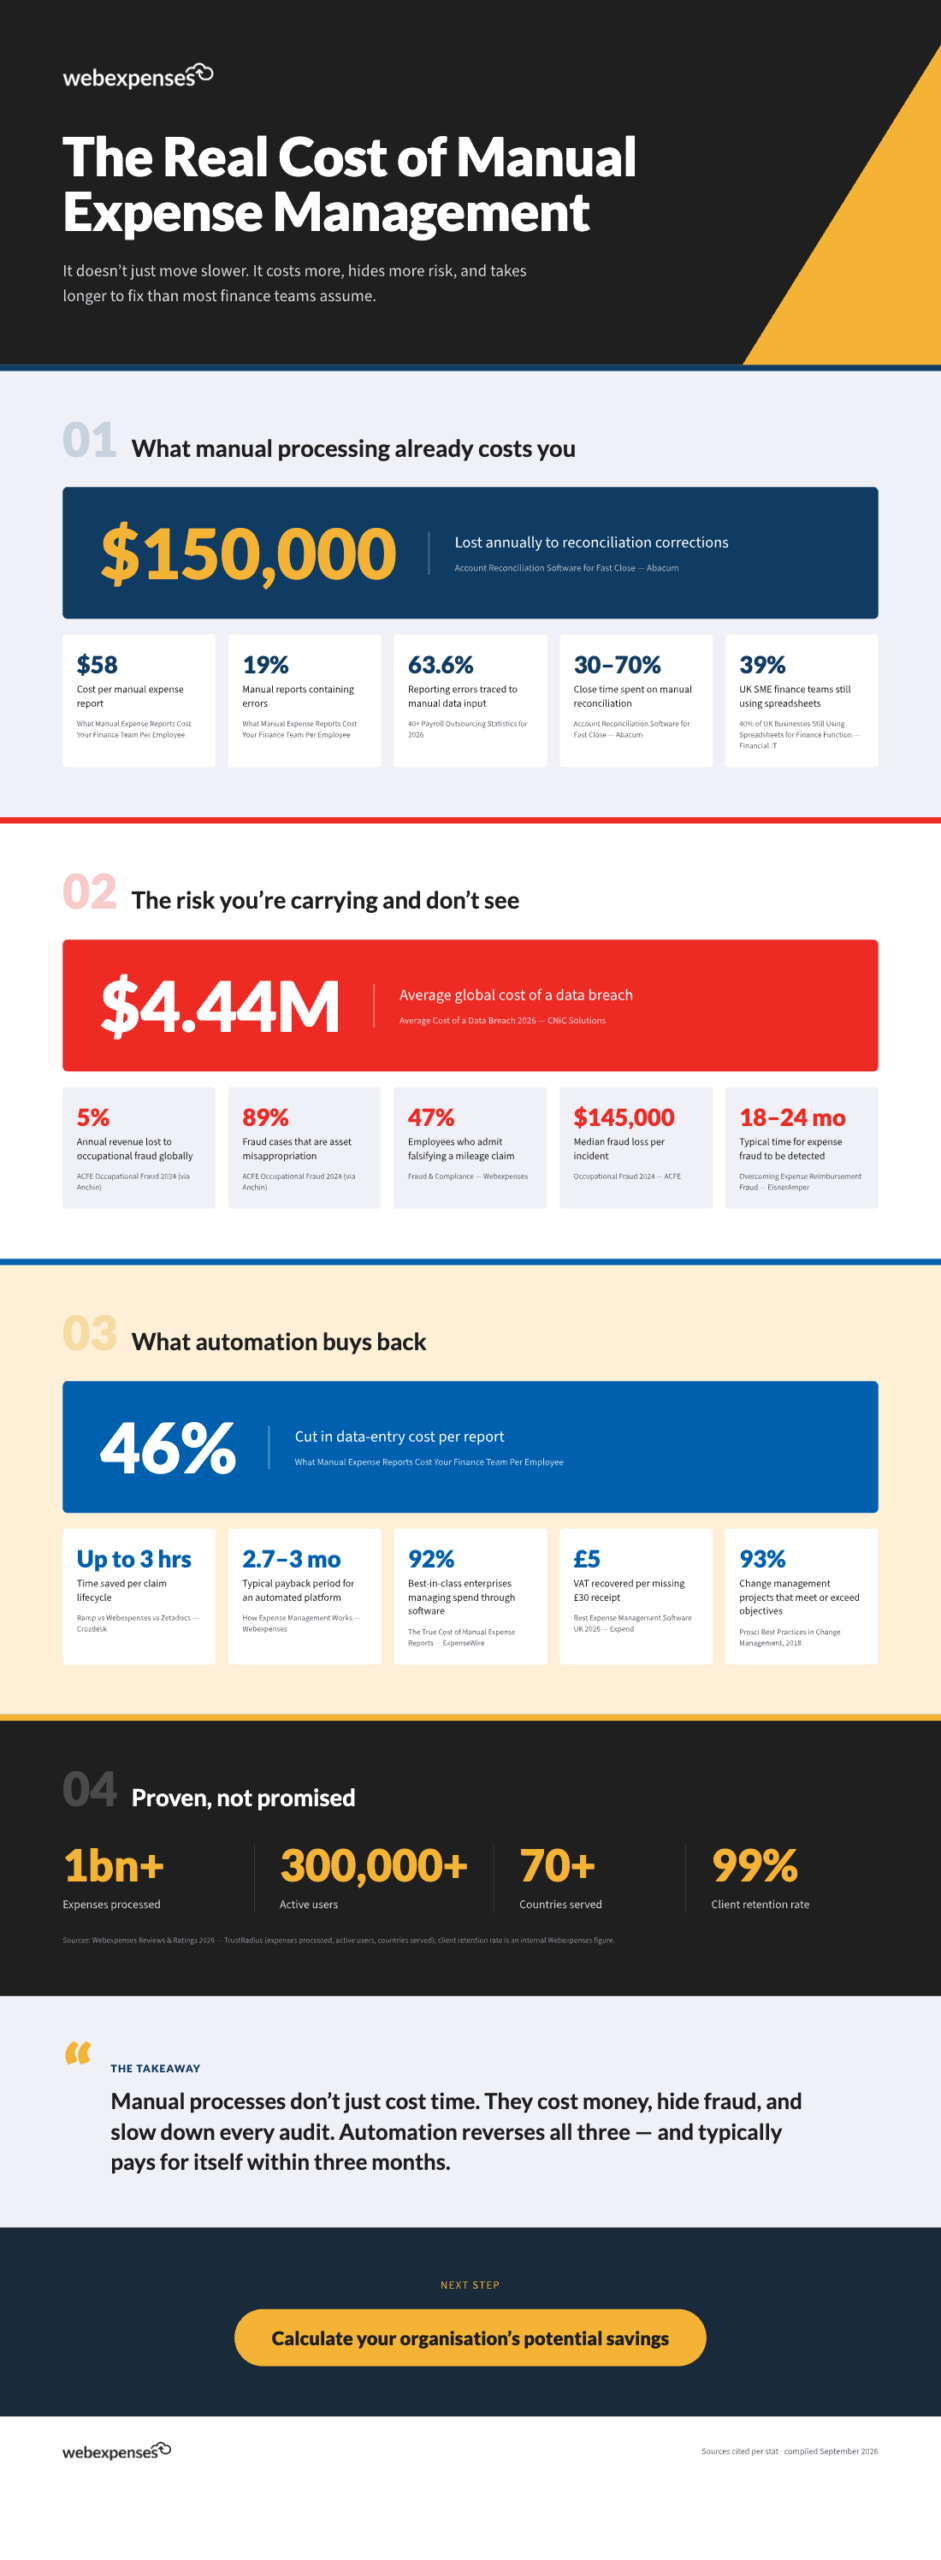
| $150,000 | lost a year to reconciliation corrections |
| $58 | cost per manual expense report |
| 19% | of manual reports contain errors |
| 63.6% | of reporting errors trace back to manual data input |
| 30–70% | of close time spent on manual reconciliation |
| 39% | of UK SME finance teams still use spreadsheets |
| Figure | What it means |
|---|---|
| $4.44M | average global cost of a data breach |
| 5% | of annual revenue lost to occupational fraud globally |
| 89% | of fraud cases are asset misappropriation |
| 47% | of employees admit falsifying a mileage claim |
| $145,000 | median fraud loss per incident |
| 18–24 months | typical time for expense fraud to be detected |
| Figure | What it means |
|---|---|
| 46% | cut in data-entry cost per report |
| Up to 3 hours | saved per claim lifecycle |
| 2.7–3 months | typical payback period for an automated platform |
| £5 | of VAT recovered on every missing £30 receipt |
| 92% | of spend managed through software at best-in-class enterprises |
| 93% | of change management projects that meet or exceed objectives |
| Figure | What it means |
|---|---|
| 1bn+ | expenses processed |
| 300,000+ | active users |
| 70+ | countries served |
| 99% | client retention rate |
Sources are listed on the infographic. Want to put these numbers in front of your board? Read The business case for expense management automation, or work out your own savings with the ROI Calculator.
With Webexpenses, receipts are captured and checked against policy as they are submitted, so you spend less on processing, catch more before it is paid, and close faster.
For the decision-maker
For the team doing the work
Platform
FRONT OFFICE
BACK OFFICE
Capabilities
EXPENSES
ACROSS THE PLATFORM
TRUST AND ROADMAP
Vendor Validation
Broader Audience